Scrum
Scrum is one of the agile project management methodologies. In Scrum, time is the most important resource to be managed. Also, Scrum focuses on training self-organized teams. In Scrum, there is a product backlog to keep any activity that has not been planned to do. The product backlog includes small and large activities. Large activities during project life cycle are broken down into small executable activities in a process called "grooming".
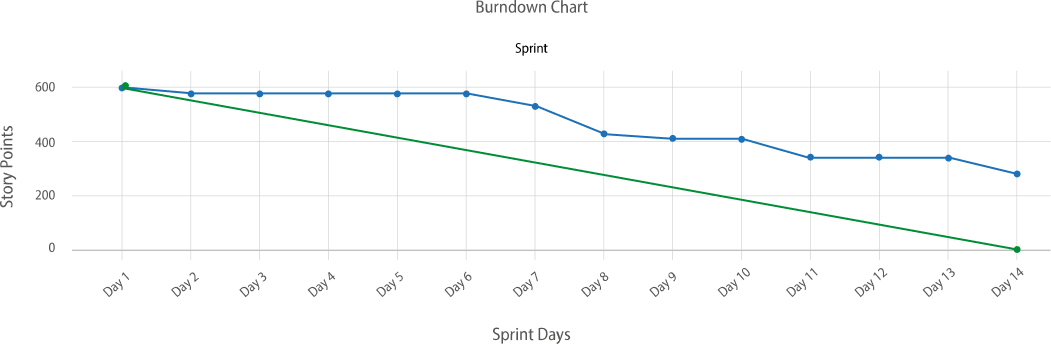
The Burn down graph is one of the most important reports in the Scrum cycle, which always shows project members how much task has to be done and how much has been done so far.
In this graph, the general status of the work execution process is clear and provides a complete view of the team's performance. Burn down graph image
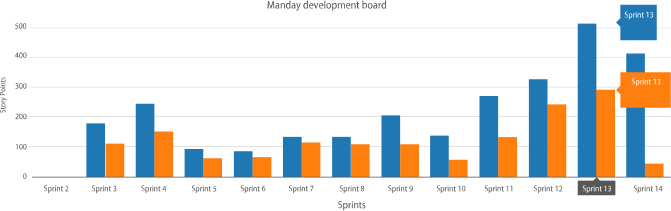
Another important graph in Scrum is the Velocity graph. This graph shows how many tasks are committed in each Sprint and how much of the task is delivered at the end. This graph compares the performance of Sprints. Velocity graph image
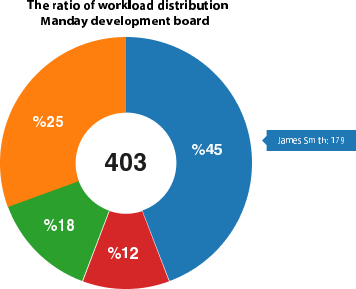
Task Distribution graph This graph shows how many tasks are assigned to each project member in a Sprint cycle. The unit of the task in this report is a story point.
The features provided to you in the Scrum product include:
- Define the Sprint
- Separate working days from non-working days.
- Recording story points for activities.
- Attach files and description for each activity.
- Recording comments and log work
- Burn-Down graph
- Velocity graph
- Task distribution graph
- Move remaining tasks to the next Sprint
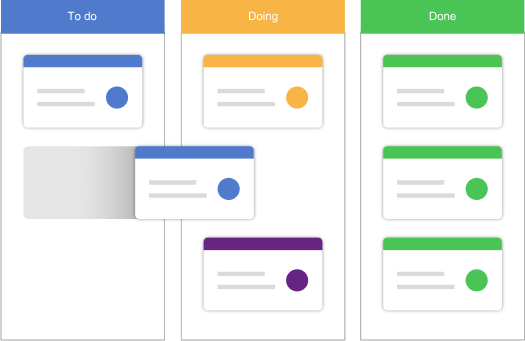
- Customize storyboard columns
- Add a watcher for columns and activities to be informed of the results of the changes.